

Lighthouse is one of the most widely used tools to grade the user experience. People across the world have been using the tool to grade the site speed. However, one of the key and often neglected issues with the Lighthouse based grading, is that the score is generated for one particular sample run on a specific Chrome browser simulated on a particular mobile device and using a specific Network and Latency settings from the USA location. Clearly, that score does not represent the user experience of that page for all traffic. In fact, many people use the score generated on the homepage as the representation of the site score.
So the first level of the problem is at the traffic pattern level. By traffic pattern, we mean the percentage of traffic being received by each page template. In most E-Commerce sites, the homepage receives only about 10% of the traffic. The Product pages receive the most traffic, followed by the Listing pages. One can not quantify the performance of the whole site looking only at the homepage.
The second level of the problem is at the download speed and latency level. Lighthouse through page speed runs on default 3G Fast connection which is 1.6 Mbps, 150 MS RTT. However it is not fair to say that all the real users of the site are landing on the site through this connection profile. Moreover the problem in India is that the median mobile latency between India and the real users is about 600 ms as per the Gemini data. So the representative network profile can not quantify the performance of the whole site.
The third level of the problem is about caching. Lighthouse will always use No cache mode to measure the performance. But in the real world, close to 50% of the users are returning users. For returning users, a lot of content is loaded from the cache. Connections for subsequent pages in the session are already established. Thus the real content loads fast. Even the CDN nodes will cache the content.
The fourth problem is about the coverage of the browsers. Lighthouse always runs on the Chrome browser. So the generated waterfall is the representation of the Chrome based rendering. But in reality, depending on the type of the site, the users may be coming from Safari, Chrome and other non Android/ Chromium browsers.
The fifth problem is about the location of the test. If run through Page Speed Insights, the default location of the Lighthouse is USA. If run through a local PC, the default location is your local desktop/ laptop. In reality, people may connect from different networks having vastly spreaded latency bands.
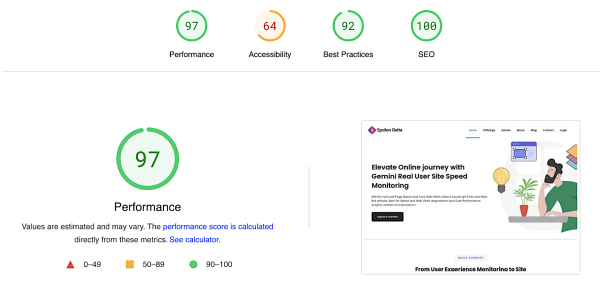
The score calculated above is based on the First Contentful Paint (FCP), Largest Contentful Paint (LCP), SpeedIndex (SI), Cumulative Layout Shift (CLS) and Total Blocking Time (TBT) of one sample of one url on 3G Fast connection from USA or local PC location on Chrome browser. But in no way, it represents the complete picture of the site and not certainly represents the Real User Score.
In Gemini, we have managed to solve the algorithm of real user SpeedIndex and real user Total Blocking Time. Thus, we are able to calculate the Gemini score based on the Lighthouse 10 Scoring algorithm. Because we have site speed data and score for each page type and samples, we are able to generate an aggregated score for the site for the real users.
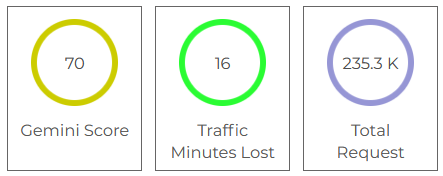
The Gemini Score is now available on our Speed Details Page, where one can see the aggregated site level and even the Company level data.
gemini score of site
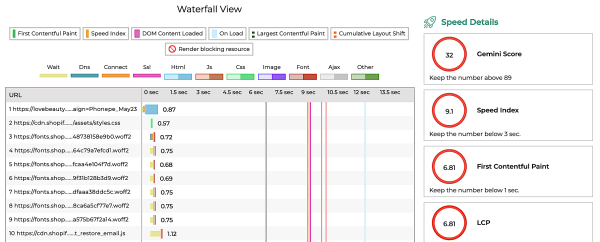
We are also showing Gemini score in the Page Waterfall for each sample. This way, the developer can easily debug the performance by looking at the score.
With the Gemini Score, you can now represent the Real user Experience of the Site in a reliable way. The score gets generated automatically. No need to run them. The score is also available in the download data. We recommend shifting to real user Gemini Score for the whole Site data.