

Site speed forms a very important aspect of the User Experience. In today’s digital world, customers are less tolerant to the slow sites. Internet users have faulty perceptions of time. Accordingly to a research, an average person perceives the page load as 15% slower than the actual time. However while recalling this experience to others, he/she calls the page to be 35% slower than the actual speed.
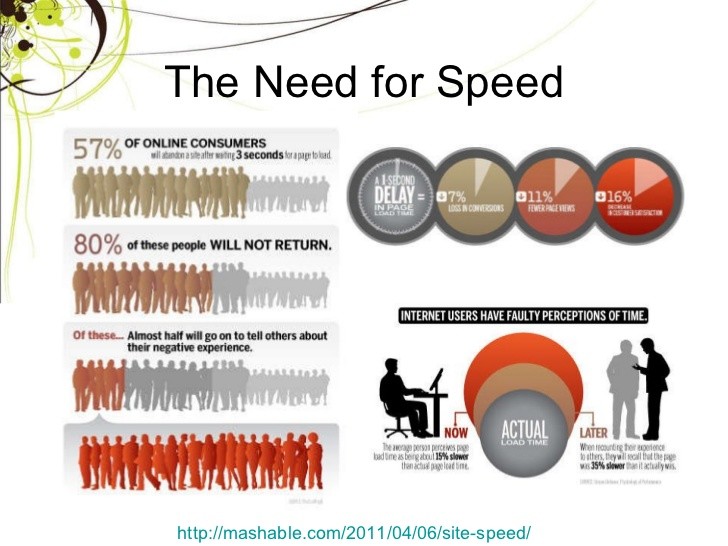
Another study states that 57% of the online users will abandon the site if it takes more than 3 seconds to load. 80% of these users will not return. Almost half of it will go on telling others about their negative experience. Thus slow speed affects the overall reputation of the site and it becomes very difficult to acquire and retain new users. Most users will simply abandon the site than complaining about the speed problems. Hence it is very important to measure the speed of the site as faced by the users.
What needs to be done to measure speed of the site!
There are two methods available on a broad level to measure the speed. Synthetic method or real users measurement (RUM) method. RUM is always the preferred method to measure performance as it is the actual source of truth. No matter what browsers, what ISPs what condition the users are browsing the site, the RUM will always capture the data and will tell you true picture. While it is now clear that we need to measure the speed in order to understand the true picture, we need to identify how do we capture the user experience as the speed perception.
Optimized vs UN-optimized Rendering!
Traditionally, most free and commercial tools rely on the ‘Onload’ event to stop measuring the page load time. So the time from the request is fired to when the Onload event is fired, is measured and presented as the speed of the page. Few such examples are Google Analytics etc. Consider following example of rendering screens.
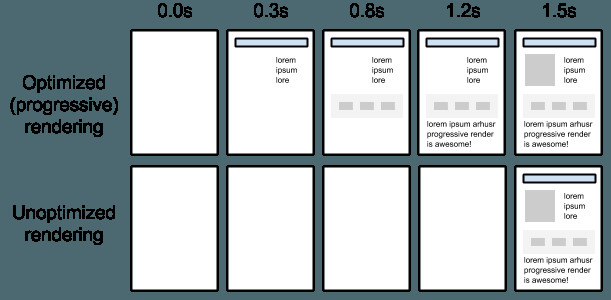
The above image shows screenshots taken at different intervals when two pages are loaded simultaneously. While the site with the optimized (progressive) rendering, renders the page gradually, the Un-optimized site paints the page only at the last. Both pages finish at the same time at 1.5 seconds and will have same Onload time. However users will definitely prefer the optimized rendering as they can see that the server is responding with the page of the request url almost immediately than shown a white screen for a long time.
Introducing Core Web Vitals
Google has introduced the Core Web Vitals as the de-facto parameters for measuring the site speed. The parameters are based on the page visible area in the view port, page element movement and the interactivity. We will share details about the core web vitals later.
Top image credit- https://www.epsilondelta.co/blog/wp-content/uploads/2022/09/1520076678178-1024×640-1.jpg