
Traditional RUM tools Limitations
Traditional RUM tools measure the core web vitals and other speed parameters for the HTML. In Single page Apps (SPA) and Progressive Web Apps (PWA), the browser sends an initial GET request to the server, which sends back a html file, Depending on the architecture, the browser either renders the page or makes an AJAX/FETCH request for data, and the server responds by sending the data in json format. The data gets rendered on the client’s screen through the javascript.
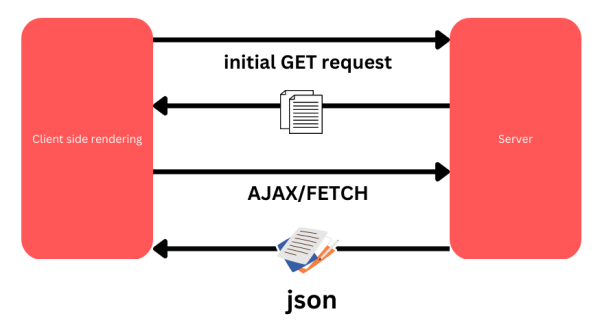
However, from the second page onwards, there are only the ajax/ fetch API calls which return the json object. The javascript in the memory will then render the page. This is also called “soft routing”. Because there is no html downloaded from the server for second request onwards, traditional RUM tools aren’t able to monitor the speed parameters of SPA and PWA websites loaded through the soft routing. For such pages, the traditional RUM tools will show the ajax/ fetch api load times only, with no screen painting related data. However, Gemini measures these soft routes in the same way as a normal website. Gemini detects the First Contentful Paint (FCP) and the real user Speed Index in the soft operations as well.
Monitoring SPA/PWA soft route using Gemini
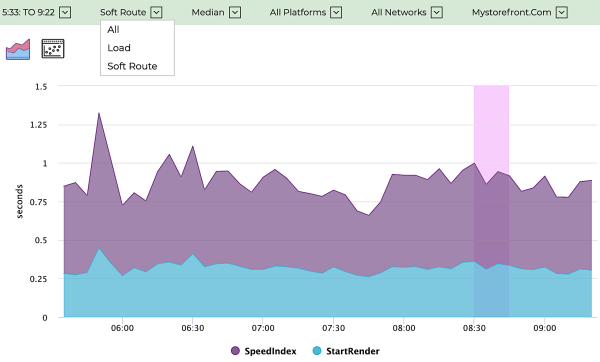
As we see in the image below, Gemini users can track the Speed Index and First Contentful Paint (StartRender) of SPA and PWA similar to traditional webpages. Users can also select specifically the “soft route” options if they only want to track them.
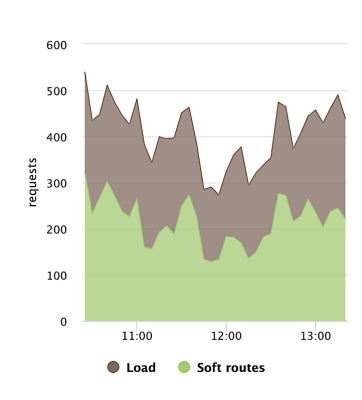
As we see in the image below, Gemini can directly show the percentage of load and soft route requests in a single graph. This is a good way of checking if SPA or PWA architecture is working as desired. More the percent of soft route pages, better the operational efficiency and faster the user experience.
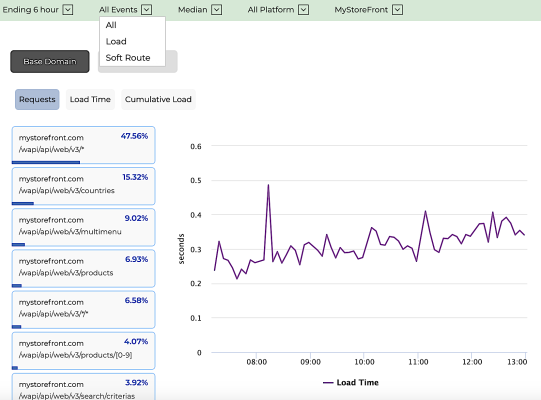
As shown in the image below, Gemini also tracks ajax/ fetch API requests and their real user load time. Depending on the requirement, users can choose between soft route, Load or all requests.
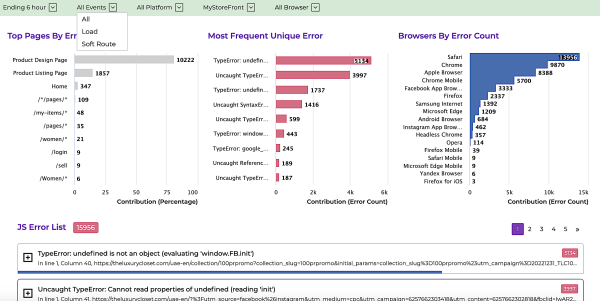
Users can also track JavaScript errors from the soft routed operations, including the page name, with the choice of selecting between load, soft route, or all, as shown in the image below.
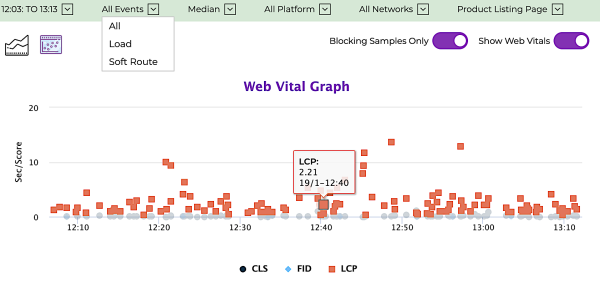
Gemini can also track blocking samples in SPA/PWA soft routes, as we see in the image below. Depending on the requirement of users they can choose between Soft Route or Load or all requests.
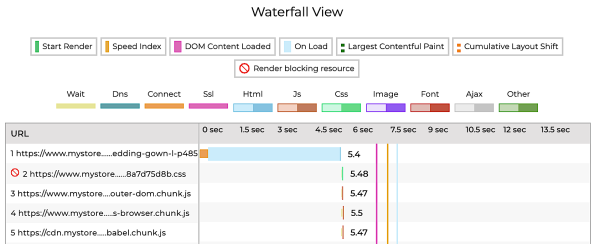
Users can audit the page waterfall in the online user journey and detect page waterfall issues to correct the user experience with the choice of selecting between load, soft route, or both, as shown in the image below.