Why does site speed matter?
Website speed is one of the most important factors during and after the creation of a website, as it directly affects the user experience on the website, the customer conversion rate, the number of repeat customers, and most importantly, the SEO ranking of your website. In April 2010, Google announced that they will use site speed in terms of Core Web Vitals as a signal to the Search indexing.
Core web vitals
Google announced that the following 3 Core web vitals will be used to measure the site’s performance:
CLS (cumulative layout shift) measures the stability of the web page after the website has been loaded.
FID (first input delay) measures the time when the user is able to interact with the website at its earliest.
LCP (largest contentful paint) measures the time when the largest content, which might be an image or a block of text, is loaded.
Why Speed index?
when a user loads a website and if the website takes 3 seconds or more to load. The bounce rate of the user increases by approximately 30%, and this number keeps on increasing in proportion to the website load time. With the recent advancements in technologies in web development and at a time when the attention span of people keeps getting shorter and shorter, the expectations of users have increased dramatically. The slower the websites are, the more the frustration of users increases. The problem is that when a user loads a website for those seconds, depending on the website, the user is shown a blank white screen.
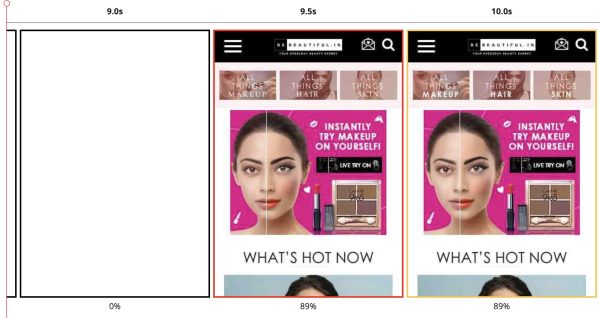
As we see in the image above, the first painting happened at the approx 9.5-second mark, before which the users were shown a blank white screen. Despite the fact that the DOM content was being loaded in the traditional web page test, nothing was being painted on the screen.
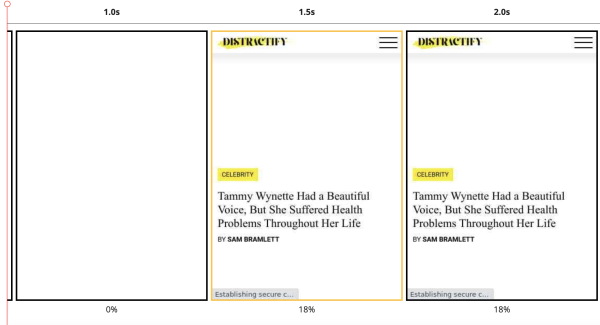
As we can see in the above image, the first painting happened at the 1.5-second mark, even though the DOM content was still being loaded, just like in the previous example, but the user could see something being painted on the website. As a result, the bounce rate decreases a lot. This is why the speed index metric is so important. The difference between the first and second examples is extremely high, as it will give the users a completely different user experience and a huge difference in bounce rates.
LCP only measures the biggest element, which might be an image or a large block of text, and its location might be anywhere on the web page above the fold, while FCP only measures the time taken by the website to render the first visible pixel on the webpage. Consequently, it makes them incomplete metrics to measure real user experience, as they only track one element. Hence, a metric known as the “speed index”, which was introduced in 2012, becomes very important.
What is the speed index?
The speed index metric calculates the average time the visual content takes to display as a website page loads. Speed index differs from other metrics like LCP (large contentful painting) and FCP (first contentful painting) as it takes into consideration all the elements present on that web page. It indicates that above-the-fold content loaded much earlier, giving the user the perception of a faster-loaded page.
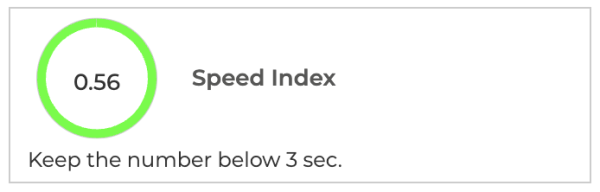
In simple words, a speed index is a metric that shows how efficiently the content of your website is being loaded in the viewport. It’s not necessarily helpful by itself to diagnose problems; hence, we also need other speed metrics. As a result, these other metrics are not obsolete. The time is shown in milliseconds, and the lower the score, the better it is.
Measuring speed index using Lighthouse
In 2016, Google introduced Lighthouse as a plugin, but in 2018, Google directly integrated Lighthouse into its Chrome dev tools. Users can use the lighthouse directly from Chrome’s dev tools and check the site speed. Lighthouse includes all the web page test metrics, including the speed index. And through the lighthouse, users can measure the speed index for that particular web page at that particular time. But the speed index of the website keeps fluctuating throughout the day.
Lighthouse Limitations
Lighthouse is synthetic, as it slows down your page load by throttling network and CPU speeds. As a result, the lighthouse does not simulate a particular user’s experience but attempts to simulate the average user’s experience; all it does is show the calculated speed of that particular page of that website. As a result, the lighthouse fails to show a real user experience. It doesn’t track your website’s performance history over a period of time. Hence, users don’t have any data to compare their recent performance with. Also, it is very difficult to reproduce the issue for the logged-in experience by running tests in the lighthouse. Lighthouse doesn’t work on the Safari browser.
Measuring speed index using Gemini
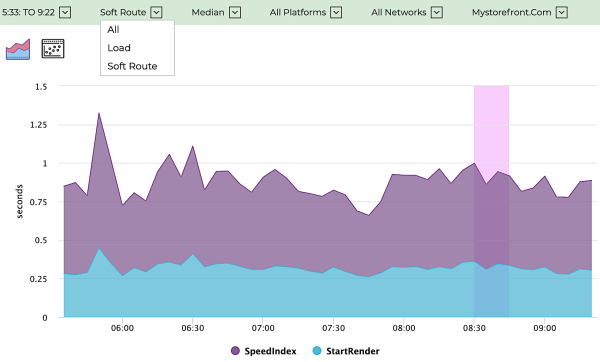
At EpsilonDelta, we identified the problems related to site speed faced by the users and came up with a solution through Gemini. Gemini is probably the first and only other tool among real user measurement tools to show real user speed index. Once a company integrates Gemini into its website, Gemini tracks the real user speed index data and shows the whole data in the form of graphs that can be easily interpreted by users. Gemini has been tracking the speed index Metric since its inception.
Gemini also provides real-time alerts on the Speed Index degradation. Users using Gemini will receive live alerts once there is an issue with the website’s performance, The automated root cause analysis provides huge help for the developers in resolving the issue.
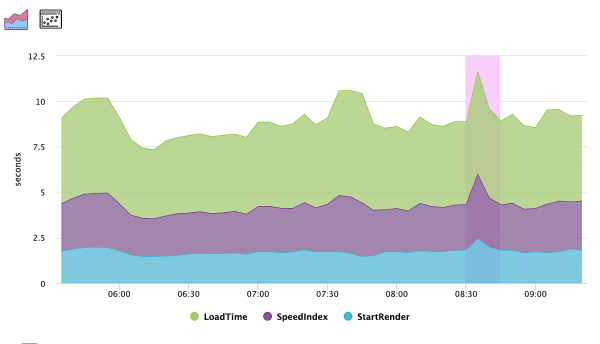
Traditional real-user monitoring tools aren’t able to monitor the soft page experience of single-page and progressive web applications. But through Gemini, the same can be monitored effortlessly. Users can also choose between hard or soft loading to analyze the speed index and use the full potential of the architecture, as shown in the image below.